Wednesday, January 11, 2012
Tuesday, July 5, 2011
custom logging in ssis
Problem
We have quite a few SSIS packages that we run on a regular basis to extract data from our OLTP systems and transform/load into our data warehouse. We would like to capture some basic information about these SSIS packages such as what packages were run, when, how long did they take to run, and how many rows were extracted and loaded. We have looked in to the built-in logging that comes with SSIS but we just don't see a straight forward way to get row counts. Are we missing something?
Solution
SSIS provides a flexible logging mechanism that is tightly integrated with the various events raised during package execution. However, the issue that you raise is accurate and the best approach is to use the built-in SSIS logging where appropriate and augment it with your own custom logging. A simple, straight-forward custom logging schema can provide the information you need. Let's take a look at a sample schema that can be used to capture the basic logging information that you have requested:
Sample SSIS Logging Data Model

Main points about the above schema:
•All of the tables are in the etl schema; it's a good idea to isolate these kinds of tables from other tables in your database.
•A row is inserted into the PackageLog table by every SSIS package that executes.
•A row is inserted into the ExtractLog when an SSIS package extracts rows from a table in the OLTP database.
•A row is inserted into the LoadLog table when an SSIS package inserts, updates or deletes rows in a dimension or fact table in the data warehouse.
•The EndTime and Success columns are updated if the package runs to completion.
•The above schema does not provide for error logging which is probably best handled using the built-in SSIS logging capabilities.
The pattern for populating the logging tables is to implement an "Init" and an "End" stored procedure for each table. The stored procedures are executed in the SSIS package using the Execute SQL task. The PackageLog stored procedures are as follows:
•stp_InitPackageLog is called at the beginning of the SSIS package to insert a row into the PackageLog table with the Start Time and Package Name; it returns the PackageLogID (identity value). The PackageLogID is saved in a package variable to update the row when the package is done.
•stp_EndPackageLog is called at the end of the SSIS package to update the row inserted in the PackageLog with the EndTime and set the Success column to 1.
Packages that extract data from a table in an OLTP system will update the ExtractLog table as follows:
•stp_InitExtractLog is called to insert a row into the ExtractLog table with the Start Time and OLTP Table Name that is being processed and return the ExtractLogID (identity value). The ExtractLogID is saved in a package variable to update the row when the extract is done. In addition the stored procedure returns the maximum LastExtractDateTime for the table; this value is stored in a package variable and used in the Data Flow to only get the rows that have changed since the last extract.
•stp_EndExtractLog is called when the extract is complete to update the ExtractCount (number of rows extracted), EndTime, LastExtractDateTime, and Success columns. The LastExtractDateTime column is a DATETIME type that is set to the maximum last update date/time extracted from the OLTP table. The OLTP table needs to provide a reliable last update date/time column in order to make this work. For example, tables in the AdventureWorks database have a ModifiedDate column that reflects the last date and time the row was updated.
Packages that update dimension or fact tables in the data warehouse will update the LoadLog table using the same pattern; i.e. stp_InitLoadLog and stp_EndLoadLog. The LoadLog table records the number of rows that were inserted, updated or deleted for a given dimension or fact table in the warehouse.
Now let's take a look at a simple SSIS package that implements the custom logging. We'll use the AdventureWorks sample database as our OLTP source, extract rows from the Sales.Customer table, and save the rows in a staging table. The following is the Control Flow for the package:
SSIS Control Flow

Next let's drill in to the Data Flow:
SSIS Data Flow

The Get Updated Customers task selects the rows from the Sales.Customer table where the ModifiedDate is greater than the maximum ModifiedDate the last time the package was run. The maximum ModifiedDate is stored in the LastExtractDateTime column in the ExtractLog table and returned in the call to the stp_InitExtractLog stored procedure (Init Extract Log task in the Control Flow). The Get Extract Row Count task simply assigns the number of rows passing through to a package variable; the row count is passed as a parameter to the stp_EndExtractLog stored procedure (End Extract Log task in Control Flow) and stored in the ExtractLog table.
Next Steps
•The sample described in this tip is just a starting point; in your particular circumstances you may find additional information that should be logged.
•The custom logging that you implement will likely provide future benefits as well; for instance in a major upgrade to an existing ETL process the information in the custom logging tables can be used to compare results between the currently deployed ETL process and your development environment.
•Custom logging is just one of a number of things that should be defined early in your development effort and made part of an SSIS package "template" that you use as the starting point for each new package.
Monday, March 21, 2011
SSIS Architecture
SSIS architecture consists of four key parts:
a) Integration Services service: monitors running Integration Services packages and manages the storage of packages.
b) Integration Services object model: includes managed API for accessing Integration Services tools, command-line utilities, and custom applications.
c) Integration Services runtime and run-time executables: it saves the layout of packages, runs packages, and provides support for logging, breakpoints, configuration, connections, and transactions. The Integration Services run-time executables are the package, containers, tasks, and event handlers that Integration Services includes, and custom tasks.
d) Data flow engine: provides the in-memory buffers that move data from source to destination.

User defined functions
Scalar User-Defined Function
CREATE FUNCTION whichContinent
(@Country nvarchar(15))
RETURNS varchar(30)
AS
BEGIN
declare @Return varchar(30)
select @return = case @Country
when 'Argentina' then 'South America'
when 'Belgium' then 'Europe'
when 'Brazil' then 'South America'
when 'Canada' then 'North America'
when 'Denmark' then 'Europe'
when 'Finland' then 'Europe'
when 'France' then 'Europe'
else 'Unknown'
end
return @return
end
Usage:
print dbo.WhichContinent('USA')
select dbo.WhichContinent(Customers.Country), customers.*
from customers
create table test
(Country varchar(15),
Continent as (dbo.WhichContinent(Country)))
insert into test (country)
values ('USA')
select * from test
- - - - - - - - - - - - - - - - - - - - - - - - - - - - - - - - - - -
Country Continent
--------------- ------------------------------
USA North America
Inline Table-Value User-Defined Function
An Inline Table-Value user-defined function returns a table data type and is an exceptional alternative to a view as the user-defined function can pass parameters into a T-SQL select command and in essence provide us with a parameterized, non-updateable view of the underlying tables.
CREATE FUNCTION CustomersByContinent
(@Continent varchar(30))
RETURNS TABLE
AS
RETURN
SELECT dbo.WhichContinent(Customers.Country) as continent,
customers.*
FROM customers
WHERE dbo.WhichContinent(Customers.Country) = @Continent
GO
SELECT * from CustomersbyContinent('North America')
SELECT * from CustomersByContinent('South America')
SELECT * from customersbyContinent('Unknown')
Multi-statement Table-Value User-Defined Function
A Multi-Statement Table-Value user-defined function returns a table and is also an exceptional alternative to a view as the function can support multiple T-SQL statements to build the final result where the view is limited to a single SELECT statement. Also, the ability to pass parameters into a T-SQL select command or a group of them gives us the capability to in essence create a parameterized, non-updateable view of the data in the underlying tables. Within the create function command you must define the table structure that is being returned. After creating this type of user-defined function, I can use it in the FROM clause of a T-SQL command unlike the behavior found when using a stored procedure which can also return record sets.
CREATE FUNCTION dbo.customersbycountry ( @Country varchar(15) )
RETURNS
@CustomersbyCountryTab table (
[CustomerID] [nchar] (5), [CompanyName] [nvarchar] (40),
[ContactName] [nvarchar] (30), [ContactTitle] [nvarchar] (30),
[Address] [nvarchar] (60), [City] [nvarchar] (15),
[PostalCode] [nvarchar] (10), [Country] [nvarchar] (15),
[Phone] [nvarchar] (24), [Fax] [nvarchar] (24)
)
AS
BEGIN
INSERT INTO @CustomersByCountryTab
SELECT [CustomerID],
[CompanyName],
[ContactName],
[ContactTitle],
[Address],
[City],
[PostalCode],
[Country],
[Phone],
[Fax]
FROM [Northwind].[dbo].[Customers]
WHERE country = @Country
DECLARE @cnt INT
SELECT @cnt = COUNT(*) FROM @customersbyCountryTab
IF @cnt = 0
INSERT INTO @CustomersByCountryTab (
[CustomerID],
[CompanyName],
[ContactName],
[ContactTitle],
[Address],
[City],
[PostalCode],
[Country],
[Phone],
[Fax] )
VALUES ('','No Companies Found','','','','','','','','')
RETURN
END
GO
SELECT * FROM dbo.customersbycountry('USA')
SELECT * FROM dbo.customersbycountry('CANADA')
SELECT * FROM dbo.customersbycountry('ADF')
the benefits of User-Defined Functions
1.we can use these functions in so many different places when compared to the SQL Server stored procedure.
2.The ability for a function to act like a table (for Inline table and Multi-statement table functions) gives developers the ability to break out complex logic into shorter and shorter code blocks.
3.ability to pass parameters into these database objects makes the SQL Server User-Defined function a very powerful tool.
Wednesday, March 16, 2011
Tuning the Dataflow Task
SQL Server 2005 SSIS: Tuning the Dataflow Task
The Dataflow task is a high performance data transformation and integration engine. It is the data processing heart of Integration Services, capable of consuming data from multiple diverse sources, performing multiple transformations in parallel and outputting to multiple diverse destinations. It supports a pluggable architecture for stock components that ship with Integration Services as well as custom components written by third parties.
For data flows with five or six components with small data loads of a gigabyte or less, the Dataflow Task will almost certainly perform adequately out-of-the-box. However, large and complex data flow loads bring their own challenges and there are often more tradeoffs and decisions that need to be made that the Dataflow task cannot make for the user or over which it has no control.
In this article, I assess the ways in which you can tune the dataflow task by tweaking some basic settings. I call these turnkey settings because there isn't a lot of measurement or process involved when deciding to use them and because the benefits from the settings can usually be seen immediately. I then move on to define a general approach you can use for identifying and resolving performance issues, and squeezing every last ounce of performance from the Dataflow Task.
Turnkey Settings for Speedup
The Dataflow Task provides a number of settings and options you can use to eliminate unnecessary work or to diminish the amount of data that must flow through it. Some of these methods involve simple property settings, while others are a bit more complex. Also covered are the things you can do in the environment outside the Dataflow Task to speed up data flow. Although these methods are presented as a series of "do's and don'ts", understand that not every tip applies to every situation and that the items presented here are only guidelines, not hard rules that must always be followed. Knowing when to apply which rules is a matter of experience grown from testing and measuring the results.
Eliminating Unnecessary Work
Often you may find that the best data flow optimization you can achieve is to simply eliminate work the Dataflow Task must do. Eliminating work is almost always preferable to making the Dataflow Task faster because you get a 100% speedup for every bit of work you eliminate. The following tips describe ways to eliminate work from the Dataflow Task:
Optimize the Sources
Most of the optimizations for eliminating unnecessary work have something to do with eliminating the data coming from the sources. The following are a few ways to eliminate unnecessary data from entering into the data flow:
Remove Unneeded Columns
Unneeded columns are columns that never get referenced in the data flow. The Execution Engine emits warnings for unused columns, so they are easy to identify. This makes the buffer rows narrower. The narrower the row, the more rows that can fit into one buffer and the more efficiently the rows can be processed.
NOTE:
Buffers are objects with associated chunks of memory that contain the data to be transformed. As data flows through the Dataflow Task, it lives in a buffer from the time that the source adapter reads it until the time that the destination adapter writes it.
Binary Large Objects (BLOBs) are particularly burdensome to the Dataflow Task and should be eliminated if at all possible. Use the queries in the source adapters to eliminate unnecessary columns.
Use a SQL Select Statement to Retrieve Data From a View
Avoid using the Table or view access mode in the OLE DB Source Adapter. It is not as performant as using aSELECT statement because the adapter opens a rowset-based on the table or view. Then it calls OpenRowset in the validation phase to retrieve column metadata, and later in the execution phase to read out the data.
Testing has shown that using a SELECT statement can be at least an order of magnitude faster, because the adapter issues the specified command directly through the provider and fetches the data using sp_prepare without executing the command, avoiding the extra roundtrip and a possibly inappropriate cached query plan.
Optimize Source Queries
Using traditional query optimization techniques optimize the source adapter SQL query. SSIS doesn't optimize the query on your behalf, but passes it on verbatim.
Flat File and Other File Sources
Retrieving data from file sources presents its own set of performance challenges because the data is typically in some format that requires conversion. For example, the Jet Provider only supports a limited set of data types when reading Excel files and flat file data are always of type string until converted. Here are a few hints on how to eliminate unnecessary data flow work:
- Combine Adjacent Unneeded Flat File Columns – to eliminate unnecessary parsing
- Leave Unneeded Flat File Columns as Strings – don't convert them to dates etc. unless absolutely necessary
- Eliminate Hidden Operations – mostly the Dataflow Task is explicit about what it is doing. However, there are some components that perform hidden or automatic conversions. For example, the Flat File Source Adapter will attempt to convert external column types to their associated output column types. Use the Advanced Editor to explore each column type so that you know where such conversions occur.
- Only Parse or Convert Columns When Necessary – Reorganize the data flow to eliminate the Type Conversion Transform if possible. Even better, if possible, modify the source column data type to match the type needed in the data flow.
- Use the FastParse Option in Flat File Source – Fastparse is a set of optimized parsing routines that replace some of the SSIS locale-specific parsing functions.
- Eliminate Unneeded Logging – logging is useful for debugging and troubleshooting but, when deploying completed packages to production, be mindful and careful about the log entries you leave enabled and the log provider you use. Notably, OnPipelineRowsSent is somewhat verbose.
10 ways to optimize the Data Flow
Aside from the obvious need to make sure you have the right indexes in place (for example, in certain cases, the Lookup Transform can benefit from having an index on the reference table), here are 10 ways in which you might optimize your data flow:
NOTE:
This list is not comprehensive – for further tips please refer to my book.
Set based operations
When possible, perform set based operations in SQL Server. For example, SQL Server can generally sort faster than the sort transform, especially if the table being sorted is indexed. Set based operations such as joins, unions, and selects with ORDER BY and GROUP BY tend to be faster on the server.
Be Mindful of Transforms with Internal File IO
Some of the stock dataflow transforms perform internal file Input/Output. For example, the Raw Source and Destination, Import/Export Column Transforms, Flat File Source and Destination and Excel File Source and Destination Adapters are all directly impacted by the performance of the file system. File IO isn't always a bottleneck, but when combined with low memory conditions, causing spooling or with other disk intense operations, it can significantly impact performance. Components that read and write to disk should be scrutinized carefully, and if possible, configured to read and write to dedicated hard drives. Look for ways to optimize the performance of the hard drives using RAID, defragmentation and/or correct partitioning.
Monitor Memory Intensive Transforms
If your package is memory bound, look for ways to eliminate the memory intensive transforms or shift them to another package. Some transforms such as the Aggregate, Lookup and Sort use a lot of memory. The Sort, for example, holds all buffers until the last buffer and then releases the sorted rows. If memory runs low, these transforms may spool to disk, causing expensive hard page faults.
Monitor Other Memory Intensive Applications
When running on the same machine as other memory intensive applications, the data flow can become memory starved, even if there is plenty of memory on the machine. This is typically true when running packages on the same machine with SQL Server. SQL Server is aggressive about using memory. You can use the sp_configure system stored procedure instruct SQL Server to limit its memory usage.
Pare Down the Lookup Reference Data
The default lookup query for the Lookup Transform is
SELECT * FROM …
Select the option to use the results of a query for the reference data. Generally, the reference data should only contain the key and the desired lookup column. So, for a dimension table lookup, that would be the natural key and the surrogate key.
Use Lookup Partial or Full Cache Mode
Depending on the requirements and the data, you should choose one of these two modes to speedup the Lookup. Partial cache mode is useful when the incoming data is repetitive and only references a small percentage of the total reference table. Full cache mode is useful when the reference table is relatively small and the incoming data references the full spectrum of reference table rows.
Lookup, Aggregate and Sort Transforms
While performant for what they do, and important when absolutely necessary, these transforms invariably degrade data flow performance. If possible, eliminate them from your data flows. Sort and aggregate data at the source, and use the MergeJoin Transform instead of the Lookup, if possible.
Increase DefaultBufferMaxSize and DefaultBufferMaxRows
Increasing the values for these two properties can boost performance by decreasing the number of buffers moving through the data flow. However, you should avoid increasing the values too much to the point where the Execution Engine starts swapping out buffers to disk. That would defeat the purpose.
Use match indexes for repeat data cleansing sessions
When the package runs again, the transformation can either use an existing match index or create a new index. If the reference table is static, the package can avoid the potentially expensive process of rebuilding the index for repeat sessions of data cleaning. If you choose to use an existing index, the index is created the first time that the package runs. If multiple Fuzzy Lookup transformations use the same reference table, they can all use the same index. To reuse the index, the lookup operations must be identical; the lookup must use the same columns. You can name the index and select the connection to the SQL Server database that saves the index.
Implement Parallel Execution
Both the Execution Engine for the Dataflow Task and the Execution Engine for the Control Flow are multithreaded.
NOTE:
The Execution Engine is at the heart of the Dataflow execution time behavior. It creates threads, plans executions, calls the various methods on components at the appropriate time and on the appropriate threads, logs output and handles errors. Please refer to Kirk's book for more details on this.
In particular:
- Use EngineThreads Property – controls the number of worker threads the Execution Engine will use. The default for this property is 5. However, as you now know, by simply adding a few components, data flow thread requirements will quickly exceed the default. Be aware of how many threads the data flow naturally needs and try to keep the EngineThreads value reasonably close to it.
- Set MaxConcurrentExecutables – if there are multiple Dataflow Tasks in the Control Flow, say 10 and MaxConcurrentExecutables is set to 4, only four of the Dataflow Tasks will execute simultaneously. Set, test and measure various value combinations of this property and the EngineThreads property to determine the optimal setting for your packages.
Four ways to Increase Insert Performance
Often the greatest data flow performance inhibitor is the sustained write speed of the destination hard drives. But there are other elements that impact destinations as well. Depending on where you are inserting data, there are some things you can do to speed up the inserts as follows (further options are listed in the book).
Use the SQL Server Destination Adapter
If running on the same machine as SQL Server, use the SQL Server Destination component instead of OLEDB Destination. Tests show a marked performance gain with the SQL Server Destination over the OLEDB Destination. This is almost always a slam dunk performance improvement.
Set the Commit Size
The Commit Size option allows you to set a larger buffer commit size for loading into SQL Server. This setting is only available in the OLEDB Destination when using the SQL Server OLEDB driver. A setting of zero indicates that the adapter should attempt to commit all rows in a single batch.
Turn on Table Lock
This option is available in the OLEDB Destination Editor. Selecting "Table Lock" also enables fast load, which tells the adapter to use the IRowsetFastload bulk insert interface for loading.
NOTE:
Fastload delivers much better performance, however it does not provide as much information if there is an error. Generally, for development you should turn it off and then turn it on when deploying to production.
Disable Constraints
This option is also available in the OLEDB Destination Editor by unchecking the "Check constraints" option.
An Approach to Data Flow Optimization
The preceding section presents a pretty long list of methods to improve the performance of your data flows and will address a large percentage of the data flow performance problems you'll run into. However, if after applying all those suggestions, you still need to squeeze some performance from your data flow, you may need to step back and take a more holistic approach to analyzing your packages. This section presents a disciplined and somewhat theoretical approach you can use to evaluate and incrementally optimize your data flows.
The Theory of Constraints
One of the more impressive books I read in college was "The Goal" by Eliyahu M. Goldratt. For me, it was an epiphany. In "The Goal", Dr. Goldratt articulates the kinds of problems businesses face when continually improving their processes and trying to get the most from their resources.
Dr. Goldratt codified his process of improvement into five steps and these steps can be applied to the optimization of data flow. I don't have room in this article to fully describe each step – you can find that in my book – but the following should give you a feel for the process.
Identify and prioritize the constraints
Identify elements of a system that limit the overall system's performance. In this step, you should focus on educating yourself about your computing environment. What are your resources and in what ways are those resources constrained?
The most common high priority constraints are, in no particular order:
- Amount of Memory Installed - Perhaps the most important factor for processing complex data.
- CPU speed - The raw processing power.
- Number of CPUs - More CPUs widen the processing pipe.
- Disk IO speed - Using slow IDE or optimized RAID drives? Important for big data throughput.
- Network Speed - Impacts cross network loads, extracts and queries.
The priorities will naturally fall out of the identification process. The most drastic decreases in performance will be caused by the highest priority constraints. To witness the effect of constraints, you need a baseline against which you can measure decreases in performance.
To understand where a given package spends its processing time, it's necessary to decompose the package into its processing time constituent parts. To do that, you must decompose the package and get a baseline measurement of its core processing time, then measure each incremental processing time increase as more components and other package parts are added to the core package. It is very important to isolate what you are measuring so that when you measure deltas, you know what causes them.
Start by decomposing the package and eliminating unmeasured constraints. For example, shutdown other applications that may consume memory or impact other resources, disconnect from networks and, if the package connects to SQL Server, replace the destination or source with a rowcount, trash, or data generation transform (if possible).
Next, take your baseline measurements. For example:
· Source->Multicast
· Source->Destination
· Source->Transforms->Multicast
Note the differences in performance between the different baselines. Once you've done that, you'll already have a good idea where some of your bottlenecks are. For example, when you replace the Multicast with a real destination, the execution time may increase, even drastically. But, when you add in transforms, you may see very little performance degradation. This is what is meant by witnessing or measuring the impact of changes.
You can then start incrementally adding previously removed elements to measure the impact each has on the overall system.
Measuring with Performance Counters
Performance counters are useful for measuring internal or otherwise hidden processes. Integration Services provides the following useful performance counters.
- Buffers in use
- Flat buffers in use
- Private buffers in use
- Rows read
- Rows written
- Buffers spooled
The most useful of these for performance measurements is Buffers Spooled. Values greater than 0 indicate that the Execution Engine has swapped buffers to disk. You should always try to avoid swapping out buffers to disk, which is usually an indication that you don't have enough memory or that you need to rearrange your data flow.
Rows Read and Rows Written help gauge the overall progress of the data flow and can be useful as sanity checks. For example, as you increase the number of rows a data flow processes, you would expect a commensurate increase in processing time. These measurements help you quickly determine if the increased processing times are warranted.
Decide how to exploit the constraint
This step is about making sure the bottleneck is never overutilized. Applying this to data flow, always try to match the data load at a transform's input with its throughput capacity. The Dataflow Task will already attempt to do this using back pressure, but that only temporarily masks the problem. It doesn't improve throughput, it just slows down the data flow. This is a tough one to get right because throughput and processing loads at an input aren't constant, so you have to rely on the Dataflow Task for the most part.
Subordinate and synchronize everything else to the above decisions.
Once you've identified the bottleneck, and you've fully exploited it as described in the last step, you should apply all the other non-constrained resources to breaking the bottleneck. Try to get any under-utilized resources to take on more of the work that the bottleneck is performing. In other words, offload work from your overutilized bottleneck resources and load it onto the laggard under-utilized resources. You can do this through techniques such as the following:
- Filtering the data before it flows into the bottleneck transform, for example, pre-building a Lookup Transform dimension reference table from the new facts so that only those dimensions that are required end up in the reference table.
- Ignoring errors and using a conditional split to filter them, for example, when doing upserts, testing shows that it is generally faster to ignore errors from the Lookup Transform and conditionally split the not found rows into an insert, than to try and handle the not found rows with an error output.
- Preprocessing the data the constrained transform will process, for example, placing a Lookup Transform before the Slowly Changing Dimension transform to filter out non-existent rows.
- Postprocessing the data in lieu of a transformation, for example, the OLEDB Command Transform performs row by row expensive operations which you can optimize by eliminating the transform and flowing the data to a table. Later, use SQL Server to perform the set based operations instead.
- Clone and parallelize the dataflow around the bottleneck. For example, if the bottleneck is a transform, segment the rows with a conditional split into clones of the bottleneck, then union all the rows back into the next transform.
Elevate the Bottlenecks
As you continue to increase the performance of the bottleneck by offloading work from it etc., and placing more of the load on other less utilized resources, the system will become more balanced and the bottleneck will eventually be broken.
If in any of the above steps the constraint has shifted, go back to Step 1.
When you take these steps, what you'll find is that you're in an iterative improvement loop. Once you eliminate one bottleneck, you'll find others. So, you start the process again until you reach your performance goal.
Summary
The Dataflow Task is pretty fast by default, but as the data flow grows more complex and the size of data loads increase, the opportunities for tuning the data flow also increase. The guidelines and methods for tuning the data flow described here address a large percentage of the performance issues you'll run into. However, if you still want to get the last drop of performance out of the Dataflow Task, use the Theory of Constraints as your guide to find and eliminate bottlenecks.
Tuesday, March 15, 2011
Snapshots
Problem
We have many SQL Server Reporting Services (SSRS) reports that use our OLTP systems as data sources. We are always adding new reports and the number of users running these reports is also increasing rapidly. We would like to look at leveraging report snapshots as a way to reduce some of the load on our database servers. Can you provide us with an example of how to do this?
Solution
A report snapshot provides the ability to run a report at a scheduled time or on demand and save the report in the ReportServer database. When a user requests the report, they automatically get the snapshot version stored in the ReportServer database rather than executing the SQL queries to retrieve the data from the underlying data source. You can schedule report snapshots to be run during off-peak hours; this can reduce the load on your database servers. You can also create snapshots manually and select which snapshot version of a report that you would like to run. You can save as many snapshots as you like or you can have Reporting Services limit the number of snapshots that are saved. Besides reducing the load on your database servers, you can use report snapshots to archive reports at a particular point in time for later viewing; e.g. month-end reports, year-end reports, etc. Depending on how many report snapshots you keep, you could use a significant amount of space in the ReportServer database.
After deploying a report, you can specify your snapshot settings by using the Report Manager. There are three requirements that must be met in order to take advantage of report snapshots:
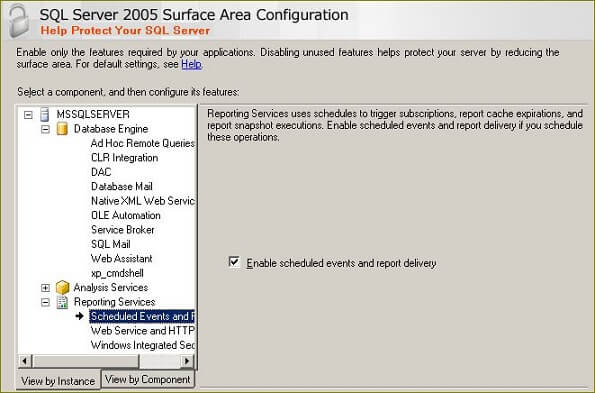
- Enable scheduled events and report delivery in SQL Server Surface Area Configuration (SQL Server 2005 only)
- Any data source used in the report must store the credentials for connecting to the database; a report snapshot can be created on a schedule so the data source cannot rely on using the credentials of the interactive user.
- All query parameters must have default values; since a report snapshot can be created on a schedule, there is no interactive user to specify these parameter values.
In this tip we will walk through the following steps to show how to enable report snapshots:
- Enable scheduled events and report delivery in SQL Server Surface Area Configuration (SQL Server 2005 only)
- Configure a data source
- Configure a report snapshot
- Execute a report from a snapshot
Enable Scheduled Events and Report Delivery
If you are running Reporting Services 2005, launch SQL Server Surface Area Configuration from the Microsoft SQL Server 2005 / Configuration Tools program group. Click on Surface Area Configuration for Features then verify that "Enable scheduled events and report delivery" is checked as shown below:
Configuring a Data Source
As an example we will take a look at a SQL Server data source. Navigate to the folder in the Report Manager where your data source is deployed, and fill in the "Connect using" part of the page as shown below:
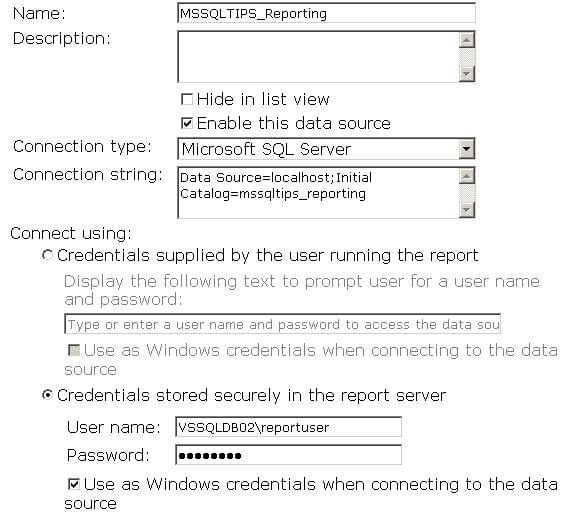
Note the radio button "Credentials stored securely in the report server" is selected, a user name and password are specified, and the "Use as Windows credentials" checkbox is selected. Whatever user name you choose must have at least read permissions on the underlying database; i.e. add the user as a member of the db_datareader database role for the particular database. In addition the user must have execute permission on any stored procedures that are used by the report; i.e. GRANT EXECUTE ON OBJECT::dbo.[stored procedure name goes here] TO PUBLIC (since the stored procedure only reads data you may want to give everyone access rather than just specific users).
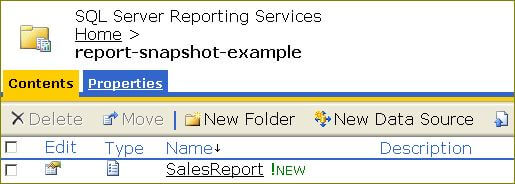
Configuring a Report Snapshot
You configure a report snapshot at the individual report level. Navigate to the folder containing your report in the Report Manager. Click the Show Details button to display the detailed view as shown below:
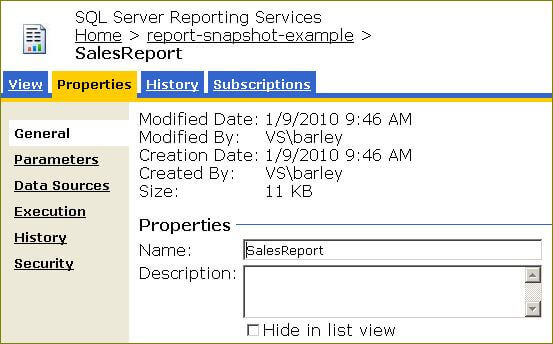
Click the icon in the Edit column for the report you want to enable the snapshot. The Properties page will be displayed as shown below:
Click on the Execution hyperlink to display the Execution Properties page for the report. Fill in the page as shown below:
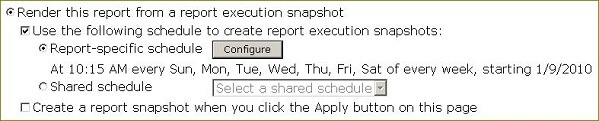
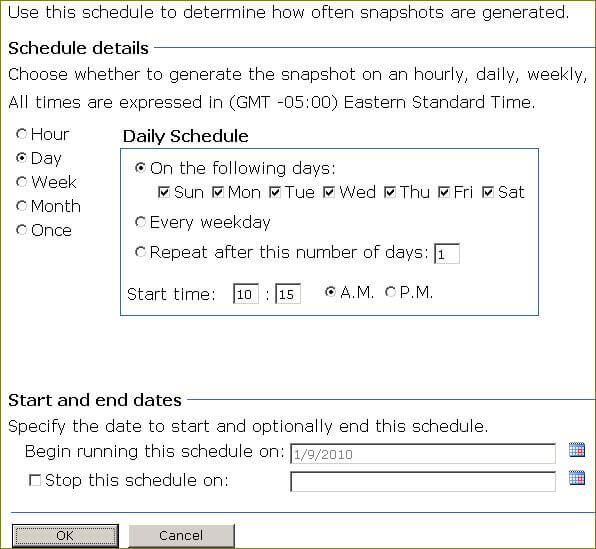
Click the radio button "Render this report from a report execution snapshot". From now on whenever a user requests this report, they will always get the latest snapshot. If a snapshot does not exist, one will be created and saved to satisfy the current request as well as future ones. You can specify to create a new snapshot based on a report-specific schedule or a shared schedule. A report-specific schedule is used only by this report, a shared schedule can be used by multiple reports. Select your schedule option and fill in the page as shown below:
Return to the Properties page as shown above and click on the History hyperlink to display the History properties as shown below:
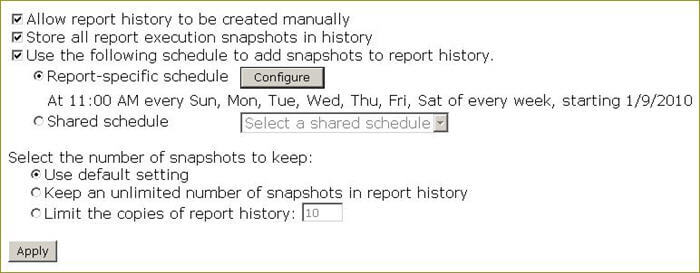
The following are the main points about the History properties:
- "Allow report history to be created manually" will allow you to create a report snapshot on demand. You can select a report snapshot to view by clicking the History tab on the Properties page where a list of available snapshots will be displayed; you can click the New Snapshot button on this page to create a snapshot on demand.
- "Store all report execution snapshots in history" will show the automatically generated snapshots in the history in addition to the scheduled snapshots.
- "Use the following schedule to add snapshots to report history" will create snapshots per your schedule and add them to the history.
- The default setting for the number of snapshots to keep is specified on the Site Settings page of the Report Manager.
There may be some confusion about specifying schedules for snapshots on both the Execution and History property pages. On the Execution properties page you are specifying when to refresh the report snapshot that is used to render the report when requested by a user. On the History properties page you are specifying when to create a report snapshot and add it to the history. You can navigate to the History property page and select which snapshot you want to view.
Execute a Snapshot Report
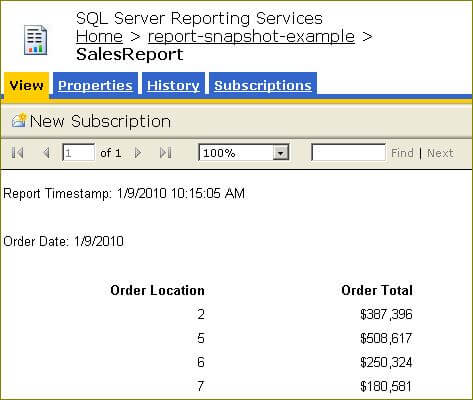
Let's take a look at the layout of the sample report that we will use to demonstrate the report snapshot:
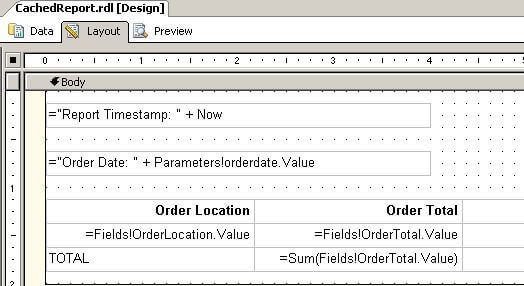
The layout is intentionally simple; the textbox with the expression "Report Timestamp: " + Now provides a simple way to determine when the report snapshot was generated. On the Execution properties page I scheduled a new snapshot to be generated at 10:15AM each day. When I run the report I can see that the snapshot was generated at about that time this morning; e.g.:
Since I configured the History properties to add all snapshots to the history, I can navigate to the History tab and select a particular report snapshot to render as shown below:
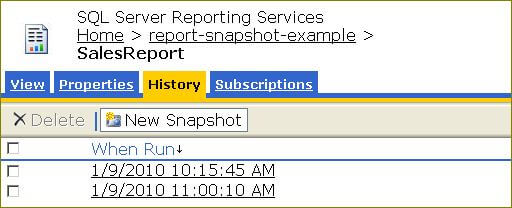
Note that there are two reports. The first one was generated based on the schedule I specified on the Execution properties page;.this is the report snapshot that will be rendered automatically when someone requests the report. The second report snapshot was generated based on the schedule I specified on the History properties page. You can click on the hyperlinks to render these reports on demand.
Next Steps
- The report snapshot feature in SSRS is the best kind; it's just a configuration setting on a deployed report. Keep this in mind when you're trying to increase performance on your database servers.
- Report snapshots can be used to archive reports as of a certain point in time; e.g. month-end or year-end.
- Report snapshots take up space in the ReportServer database so you should think about limiting the number of snapshots that you keep.
- You can download the sample report and SQL scripts to create the test data here and use it as a basis for your own testing and experimentation.
Subscribe to:
Comments (Atom)